During the development of the Weather Project, my teammate and I encountered an issue where the API appeared to function normally, but the frontend failed to call it successfully. While debugging this problem, I was reminded of a broader and more serious challenge: how to handle issues in litesite environment and ensure user requests are properly logged for debugging purposes. This led me to conduct a study on logging techniques to better understand and address such scenarios.
Best practices

Logging is a foundational element in modern software development, especially when diagnosing issues across distributed systems. In the context of full-stack applications like the Weather Project, effective logging can be categorized across three major layers:
Frontend Logging
Browser-side logs capture the user’s experience, including UI state, API errors, and interaction flows. These logs are critical for identifying client-side issues that may not be visible from backend systems.Backend/API Logging
Server-side logs record incoming requests, route handling, exceptions, and performance metrics. This layer plays a vital role in correlating frontend errors with backend responses.Infrastructure Logging
This includes logs generated by containers, serverless runtimes, load balancers, and cloud infrastructure. These logs are necessary for understanding failures related to network connectivity, deployment issues, or system resource limits.
Layered logging provides a full-stack observability model, allowing issues to be traced through the entire application lifecycle.
Python logging
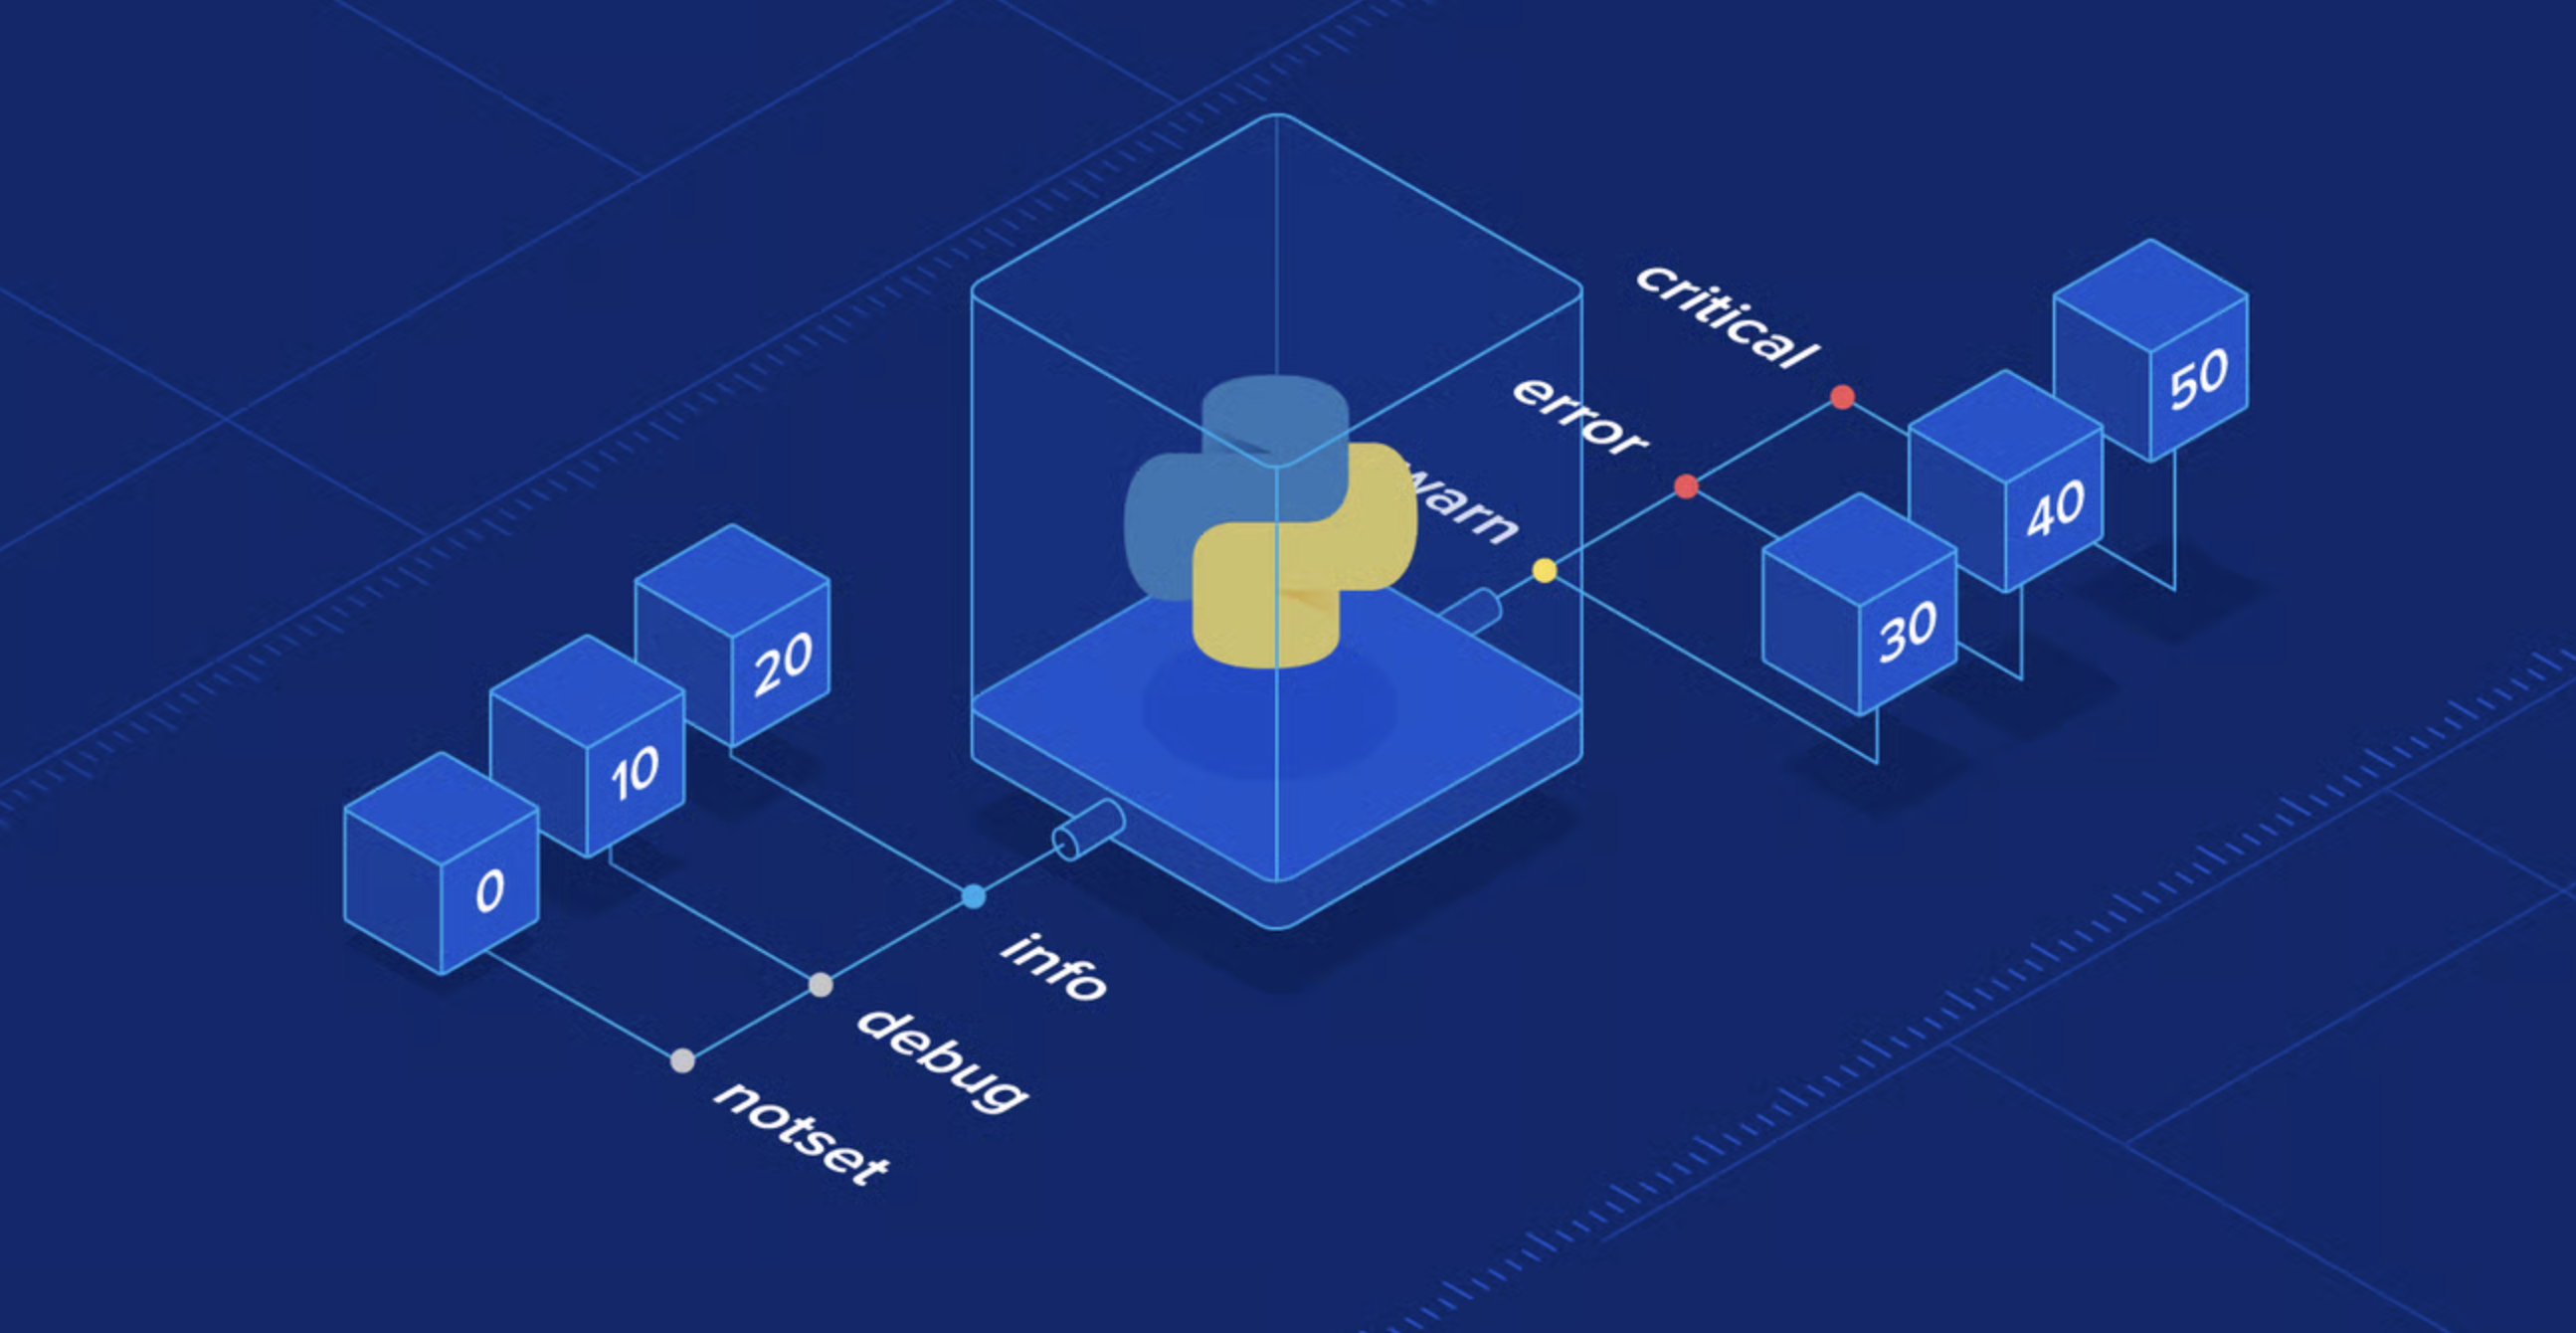
The Python logging module is a flexible and extensible system for capturing application behavior. Below is a standard setup commonly used in production-ready applications:
import logging

logging.basicConfig(
    level=logging.INFO,
    format='%(asctime)s [%(levelname)s] %(message)s',
    handlers=[
        logging.FileHandler("server.log"),
        logging.StreamHandler()
    ]
)

logger = logging.getLogger(__name__)
logger.info("Weather API started.")
This configuration provides:
- Console and file output for persistent and real-time logs.
- Log formatting for better readability and searchability.
- Modular logging using named loggers.
For observability at scale, additional tools are often integrated:
- OpenTelemetry: Enables distributed tracing and metrics collection.
- AWS CloudWatch: Offers centralized logging for AWS-hosted applications.
- Sentry, Datadog, and New Relic: Provide advanced telemetry, real-time alerts, and dashboarding features.
Frontend logging
In Vue.js applications, client-side logging is often implemented through Axios interceptors and global error handlers. These methods enable centralized error reporting and support integrations with external telemetry services:
axios.interceptors.response.use(null, error => {
  console.error("API Error:", error);
  // Optional: forward error to logging service
  return Promise.reject(error);
});
Popular tools for frontend observability include:
- Sentry: Automatically tracks JavaScript exceptions, network errors, and performance metrics.
- LogRocket: Records user sessions and correlates logs with user interactions.
- AWS CloudWatch Logs with CloudFront: Enables event logging and monitoring for AWS-hosted frontends.
Client-side logging introduces unique challenges such as handling PII, managing log volume, and dealing with varied browser environments. It is essential to implement redaction and throttling mechanisms to maintain both security and performance.
Some findings and thoughts
- Implementing layered logging significantly improves debugging efficiency by making it easier to trace errors from the frontend through to the backend and infrastructure.
- Proper logging setup not only helps resolve current issues but also acts as a preventive measure, allowing early detection of abnormal patterns in live environments.